This article tells you the process of generating trace for a concurrent program which will be helpful for debugging.
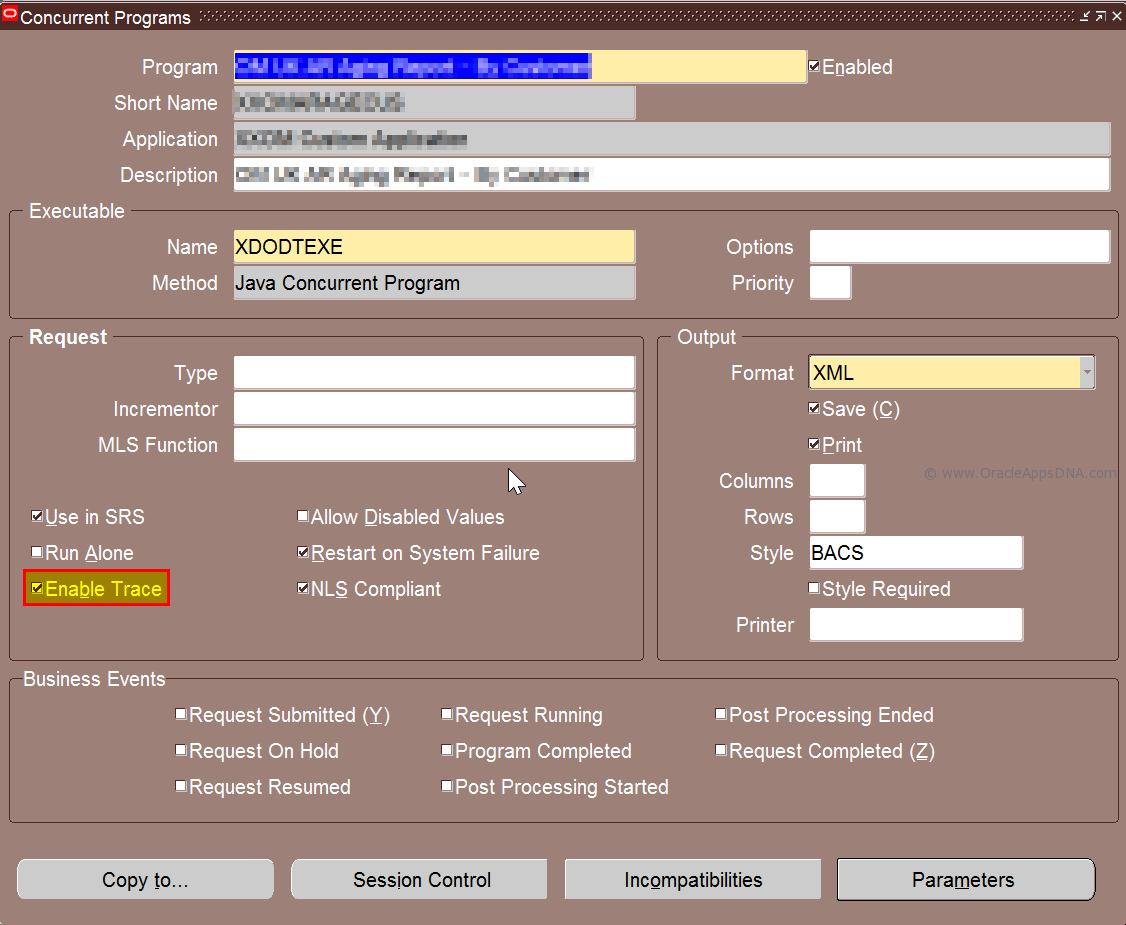
Step 1: Enable trace for a concurrent program
Navigate to System Administrator Responsibility –> Concurrent Programs –> Define and Query the program/report and then enable check box Enable trace
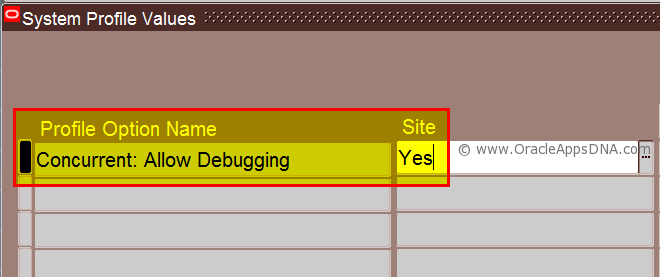
Step 2: Enabling Debugging Profile Option
Navigate to System Administrator Responsibility –> Profiles –> System
Query Profile Option Concurrent: Allow Debugging. Set profile option to Yes at Site level only.
Note: Enabling the profile option at User level may not work.
The purpose of setting this profile option is to enable Debug Options button on SRS window
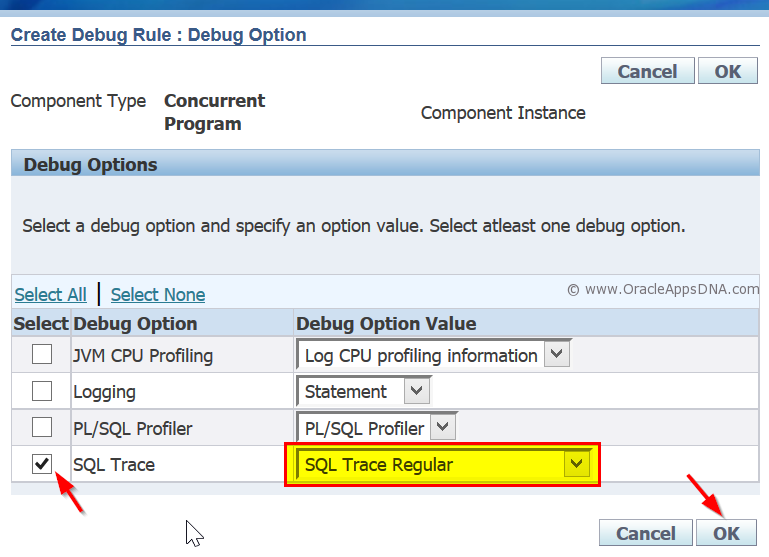
Step 3: Selecting Trace Option on SRS Window
Open SRS window and enter the program to trace and click on ‘Debug Options‘ button which will popup Debug Options page. In that page enable check box SQL Trace and select SQL Trace Regular or SQL Trace with Binding option as per need and then click on Ok button and submit the concurrent request.

Step 4: Identifying the Trace File location
Trace file is placed at user_dump_dest location, whose path can be found with below query
SELECT VALUE FROM v$parameter WHERE name = 'user_dump_dest'; |
We can also find the direct path along with the Trace File name with the below query, just by passing concurrent Request ID as parameter
1 2 3 4 5 6 7 8 9 10 11 12 13 14 15 16 17 18 19 20 21 22 23 24 25 26 27 28 29 30 31 32 33 34 35 36 37 38 39 40 41 42 43 44 45 | SELECT 'Request id: ' ||request_id , 'Trace id: ' ||oracle_Process_id, 'Trace Flag: ' ||req.enable_trace, 'Trace Name: ' ||dest.value ||'/' ||LOWER(dbnm.value) ||'_ora_' ||oracle_process_id ||'.trc', 'Prog. Name: ' ||prog.user_concurrent_program_name, 'File Name: ' ||execname.execution_file_name || execname.subroutine_name , 'Status : ' ||DECODE(phase_code,'R','Running') ||'-' ||DECODE(status_code,'R','Normal'), 'SID Serial: ' ||ses.sid ||',' || ses.serial#, 'Module : ' ||ses.module FROM fnd_concurrent_requests req, v$session ses, v$process PROC, v$parameter dest, v$parameter dbnm, fnd_concurrent_programs_vl prog, fnd_executables execname WHERE req.request_id = &request_id AND req.oracle_process_id = proc.spid(+) AND proc.addr = ses.paddr(+) AND dest.name = 'user_dump_dest' AND dbnm.name = 'db_name' AND req.concurrent_program_id = prog.concurrent_program_id AND req.program_application_id = prog.application_id AND prog.executable_application_id = execname.application_id AND prog.executable_id = execname.executable_id; |
How to read Trace File
Trace file will not be in a readable format and its lengthy, tough to understand. To make trace file readable and understandable, Oracle has provided TKPROF utility.
Read this article on how to use TKPROF utility on a Trace file.
Reference: http://docs.oracle.com/